Model Library
Global Financial Governance Platform
Turning thousands of scattered risk models into a centralised, auditable, and visually intelligent compliance platform — where design clarity reduces regulatory risk.
Executive Summary
From spreadsheet chaos to relational intelligence
At CitiGroup, thousands of mathematical models predict risk, profits, and reserve requirements. Before this project, tracking these models relied on 20+ fragmented spreadsheets — creating compliance risk and making impact analysis nearly impossible.
I led UX for the complete redesign, reframing it from a flat database into a relational intelligence platform — structured dependency graph, governed relationship workflows, and full audit traceability.
"How do you design for users who deal with 32-digit IDs, six-digit model numbers, and legal deadlines — without overwhelming them?"
The answer wasn't simplification — it was structured clarity. Making invisible relationships visible. Guiding without constraining. Auditing without burdening.
The Problem
High-stakes confusion from extreme data fragmentation
The challenge wasn't data entry — it was that users couldn't see relationships between data. A Champion model with 5 child Nodes where one missing link triggers a regulatory failure.
Information Blindness
No way to know which models were active or their lifecycle stage at any given time.
Fragmented Spreadsheets
20+ spreadsheets, no version control — teams working from different versions of the truth.
Invisible Connections
Champion models had child Nodes — impossible to see dependencies in a flat text list.
Regulatory Risk
Missing a required model review = massive penalties under Model Risk Management Policy.
"Users weren't struggling with data entry — they were struggling to see the relationships between data. That was the real problem to solve."
— Research insight, Surbhi Mahendru
My Process
Research-led, iterative design over 10 months
Discovery
SME interviews, focus groups, workflow shadowing
Define
User archetypes, journey maps, problem framing
Ideate
Wireframes, graph prototypes, flow concepts
Design + Test
Hi-fi prototypes, usability testing
Deliver
Dev handoff, ARIA specs, a11y audit
The Solution
Four design decisions that transformed the platform
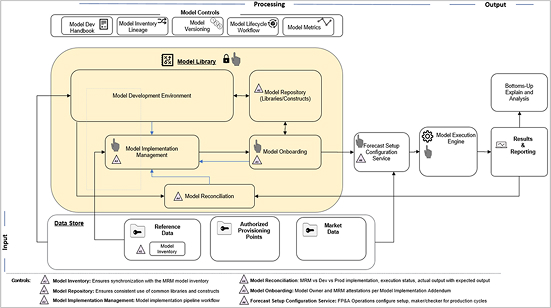
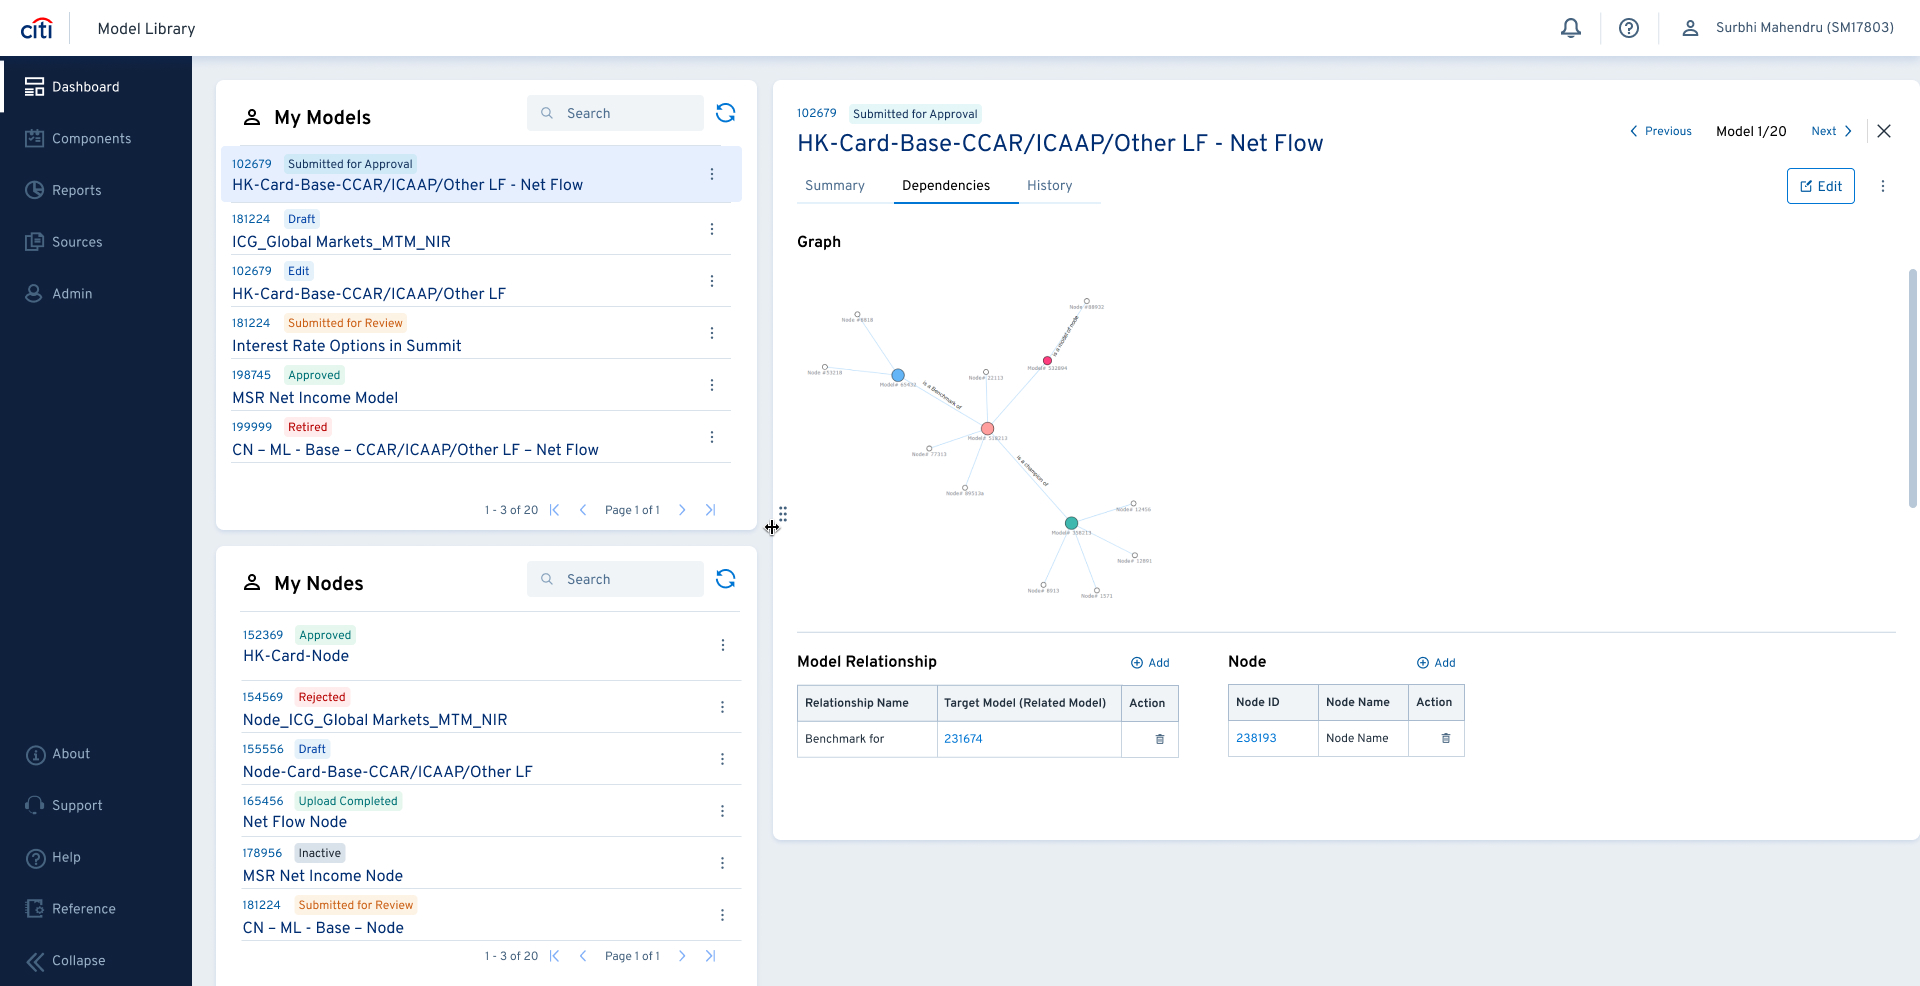
Interactive Relational Graph — Making the Invisible Visible
An interactive dependency graph — a family tree for financial models. A central Champion model connects to Nodes via semantic edge labels: "is a champion of" / "is a benchmark of". Risk Managers see the blast radius of any change in seconds, not hours.
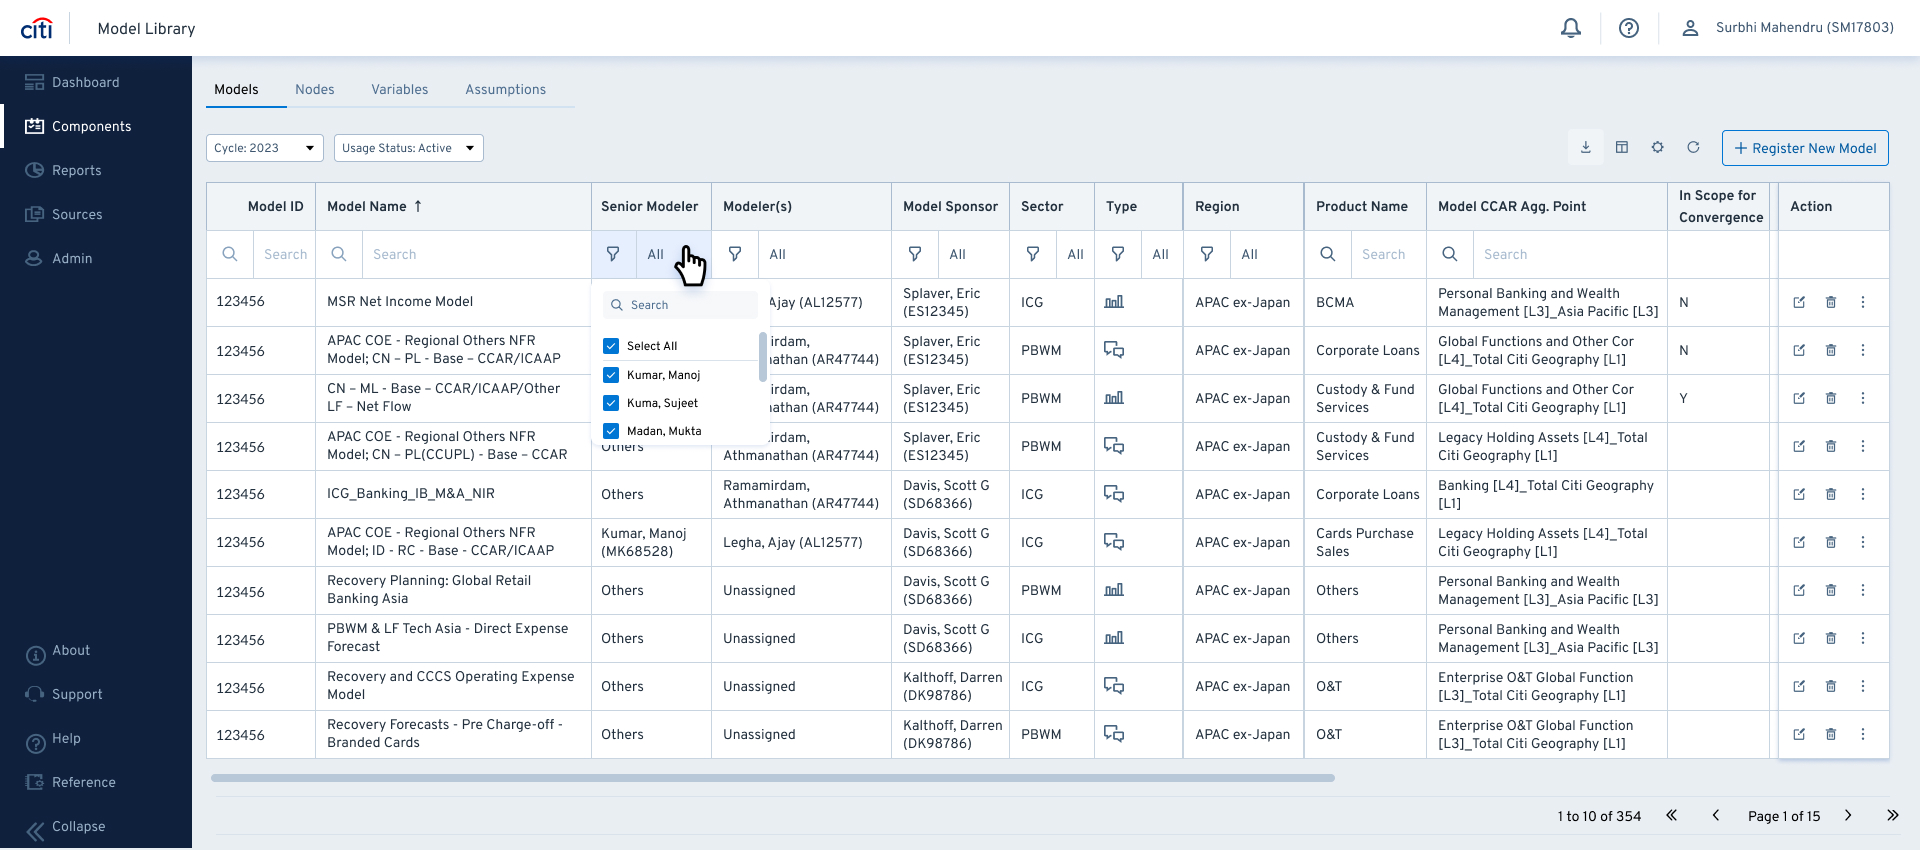
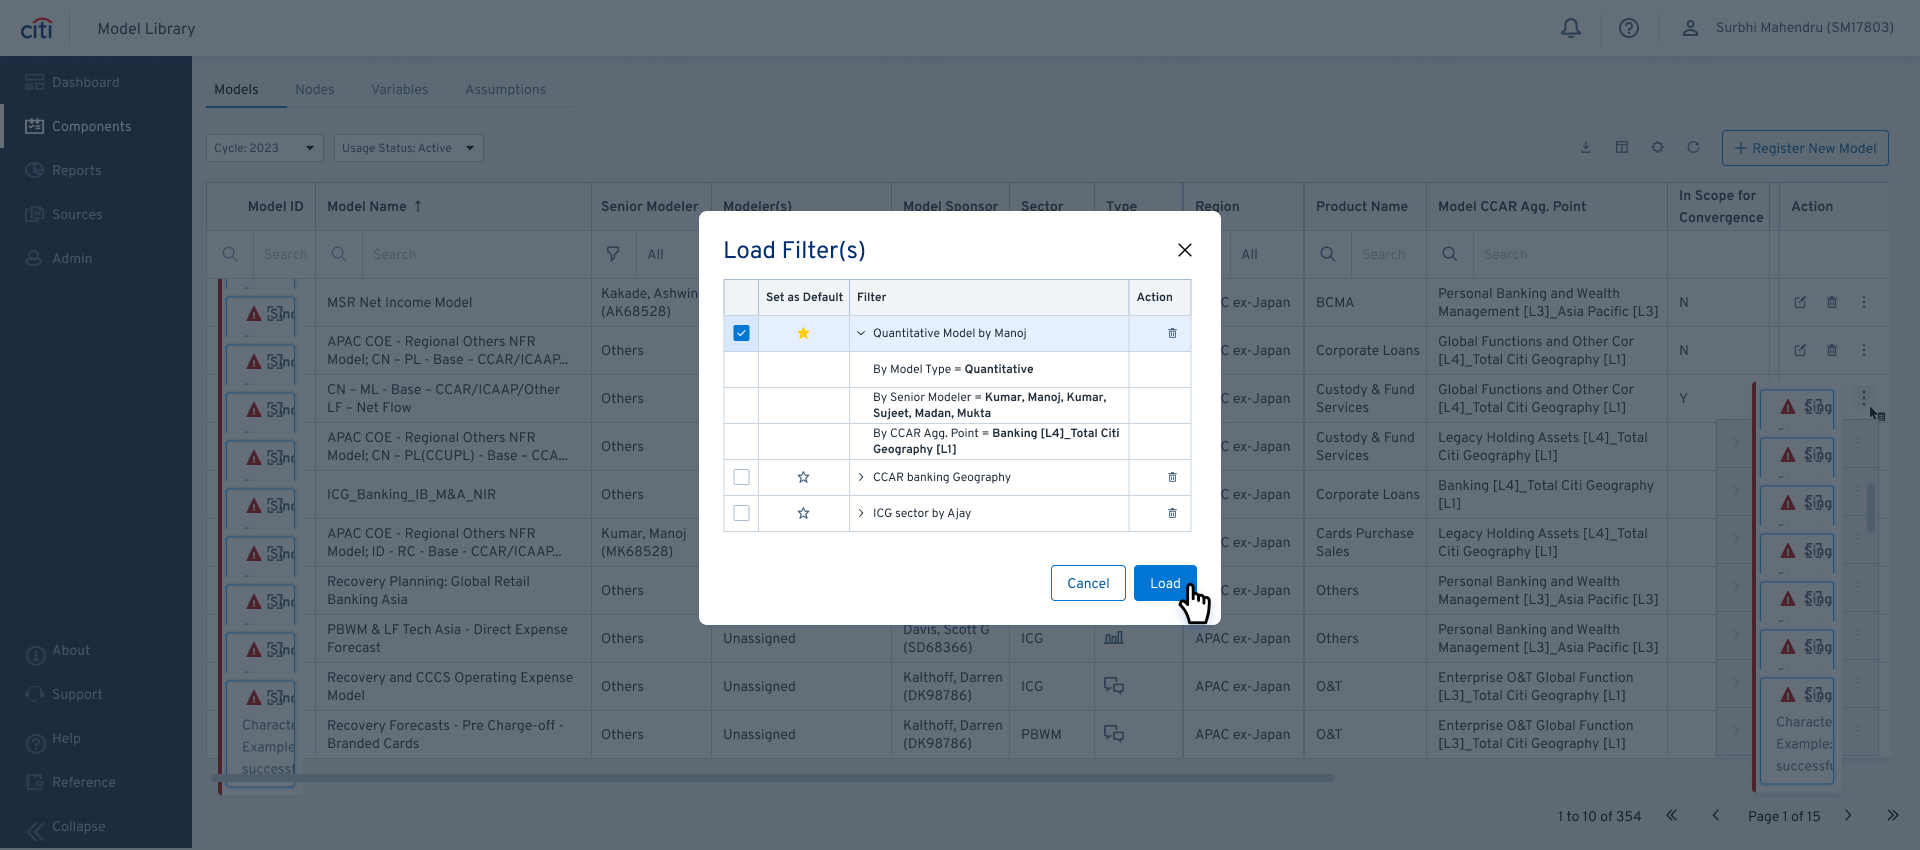
Status System + Advanced Filtering for Power Users
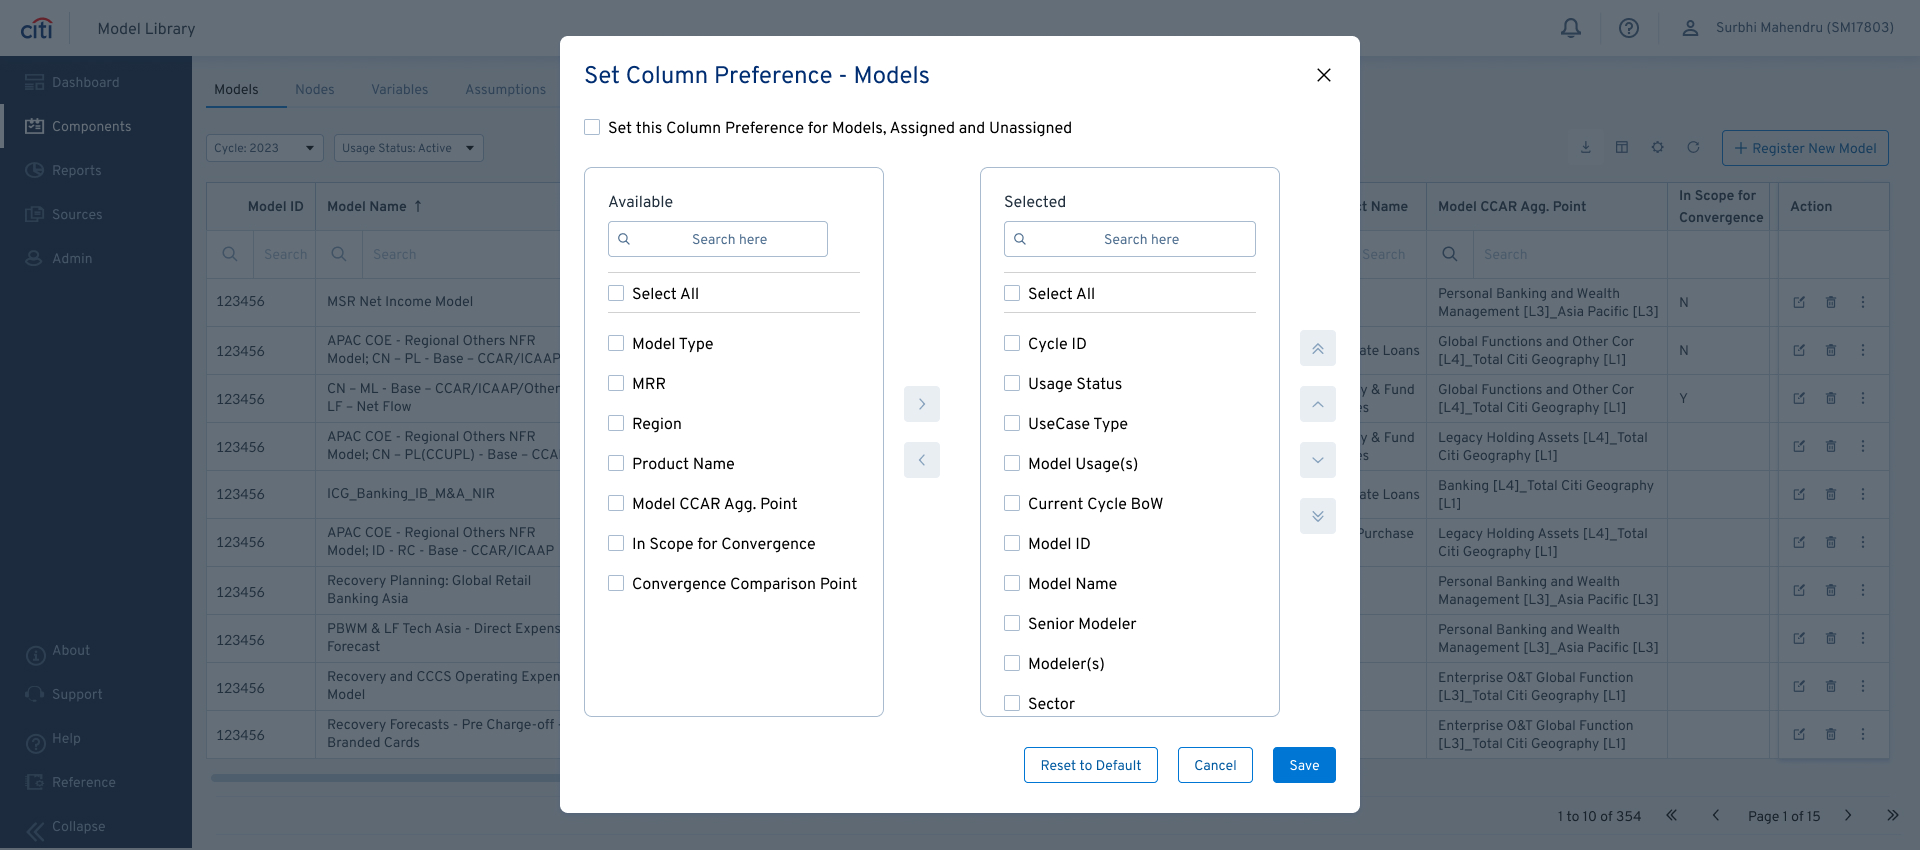
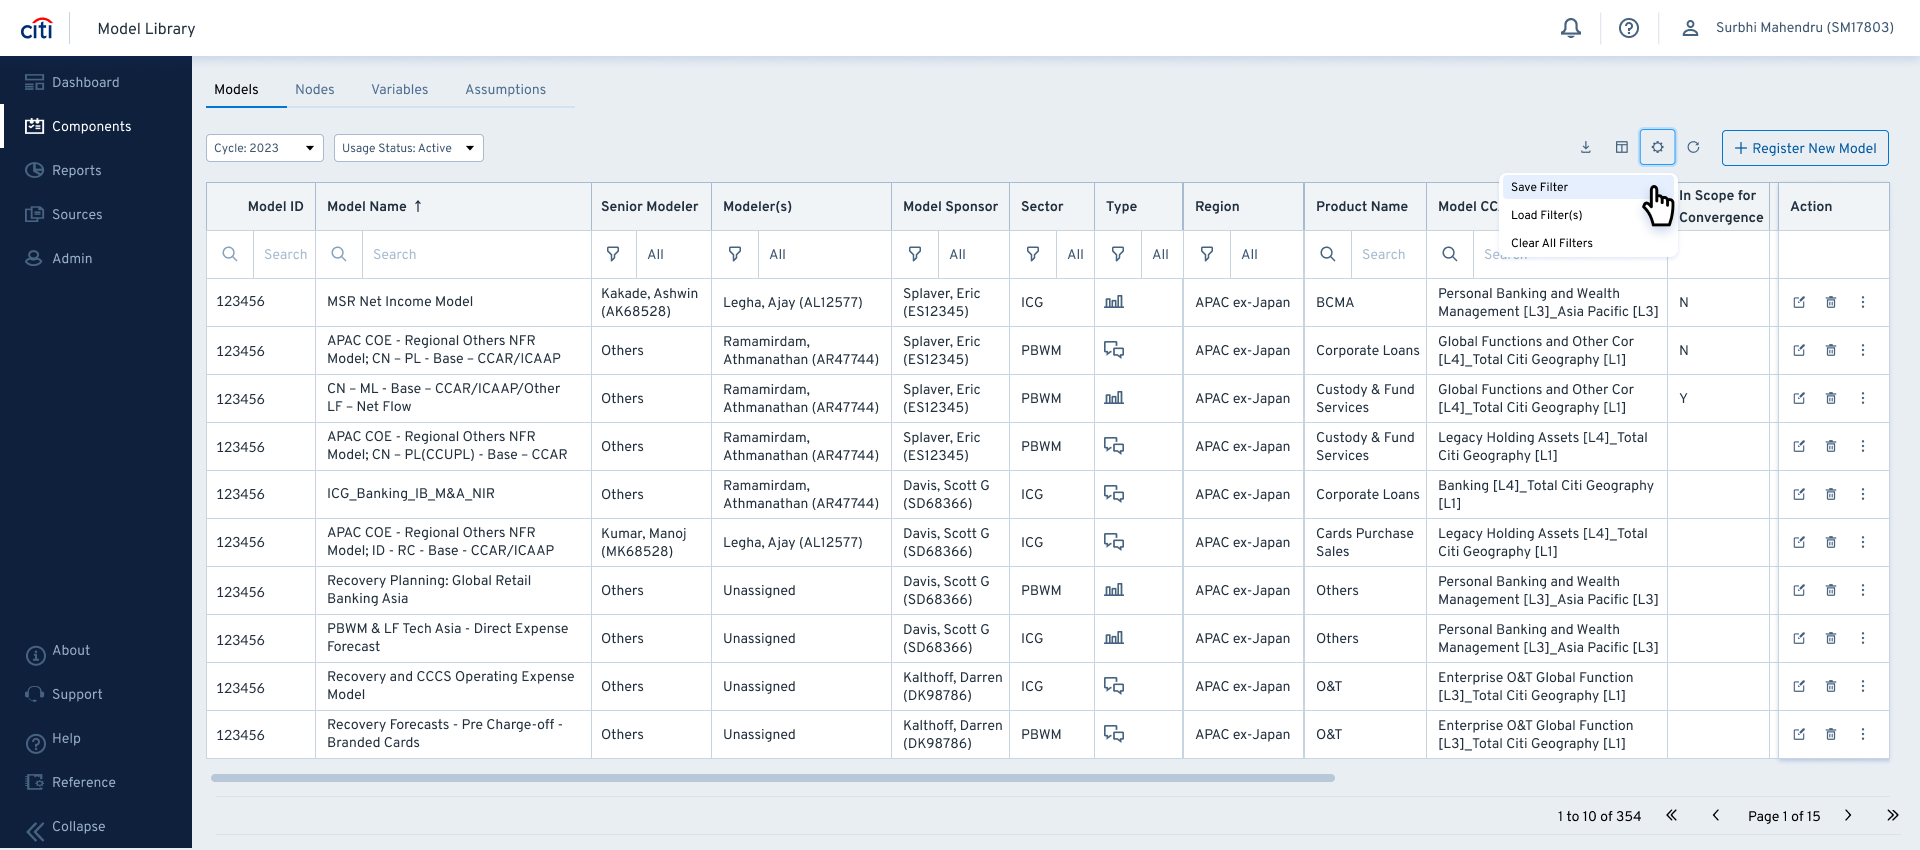
Colour-coded status taxonomy (Approved, Under Review, Submitted, Draft) with risk-rating indicators. Combined with saved filter presets and column preference modals — users reach relevant data in one click, not five.
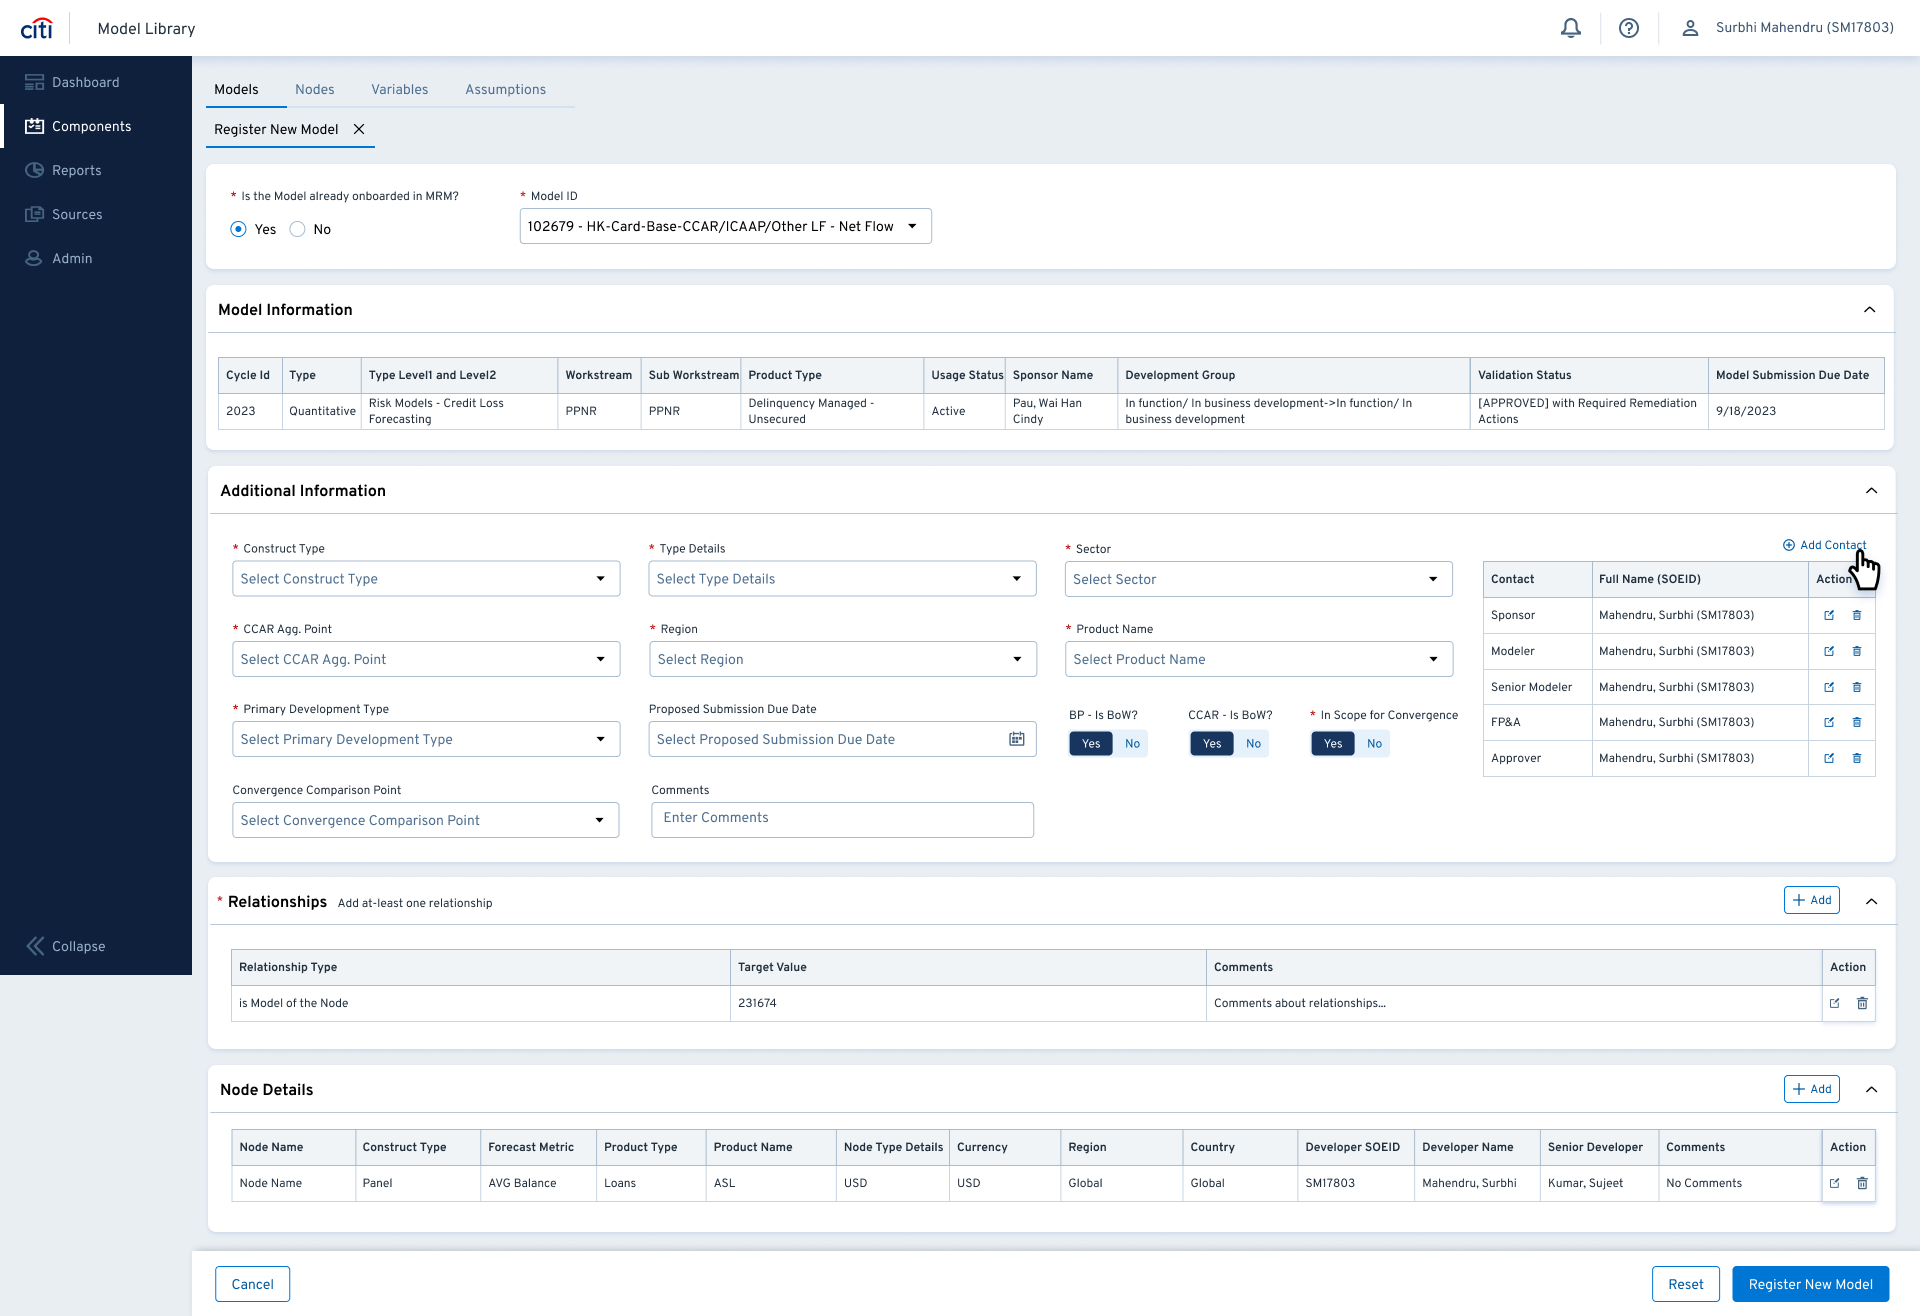
Multi-Step Registration — Guided, Not Overwhelming
5-step registration with progressive disclosure. Each step focuses on one concern: Basic Info → Relationships → Contacts → Risk Rating → Review. Inline validation prevents errors from snowballing. Node mapping integrated from step one.
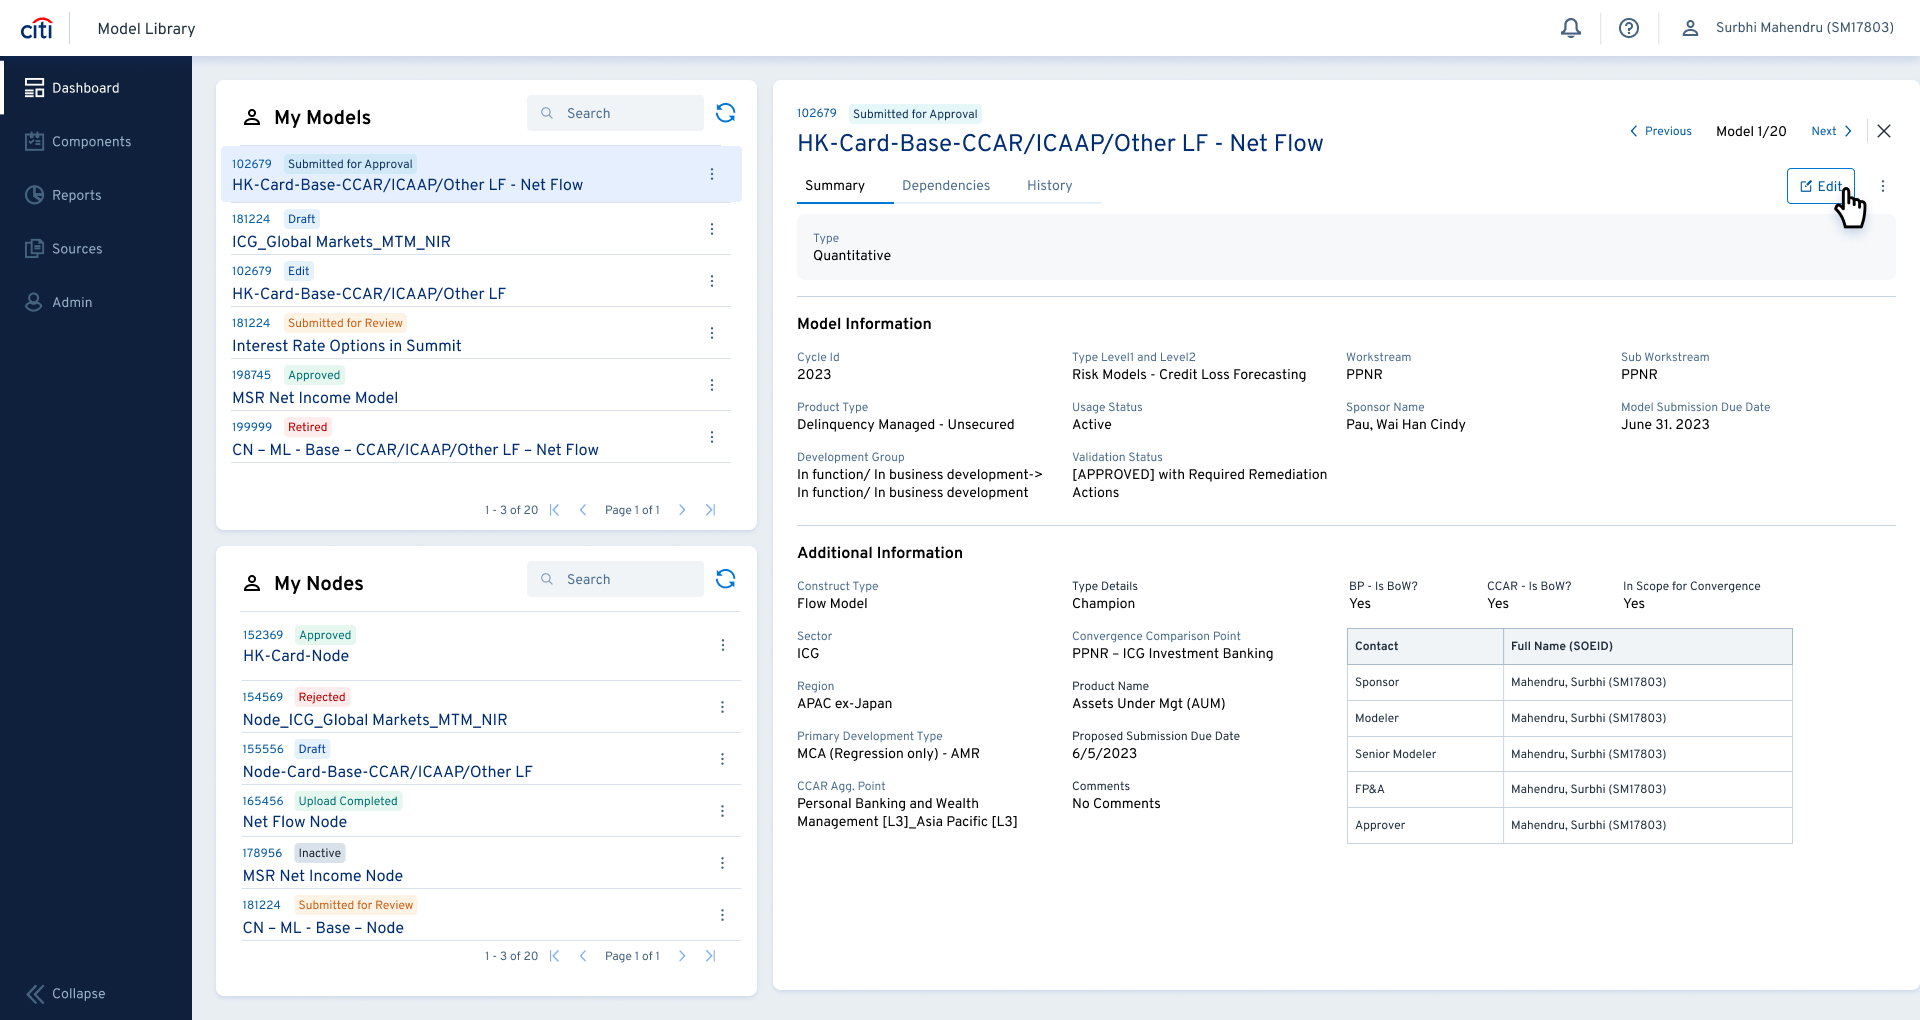
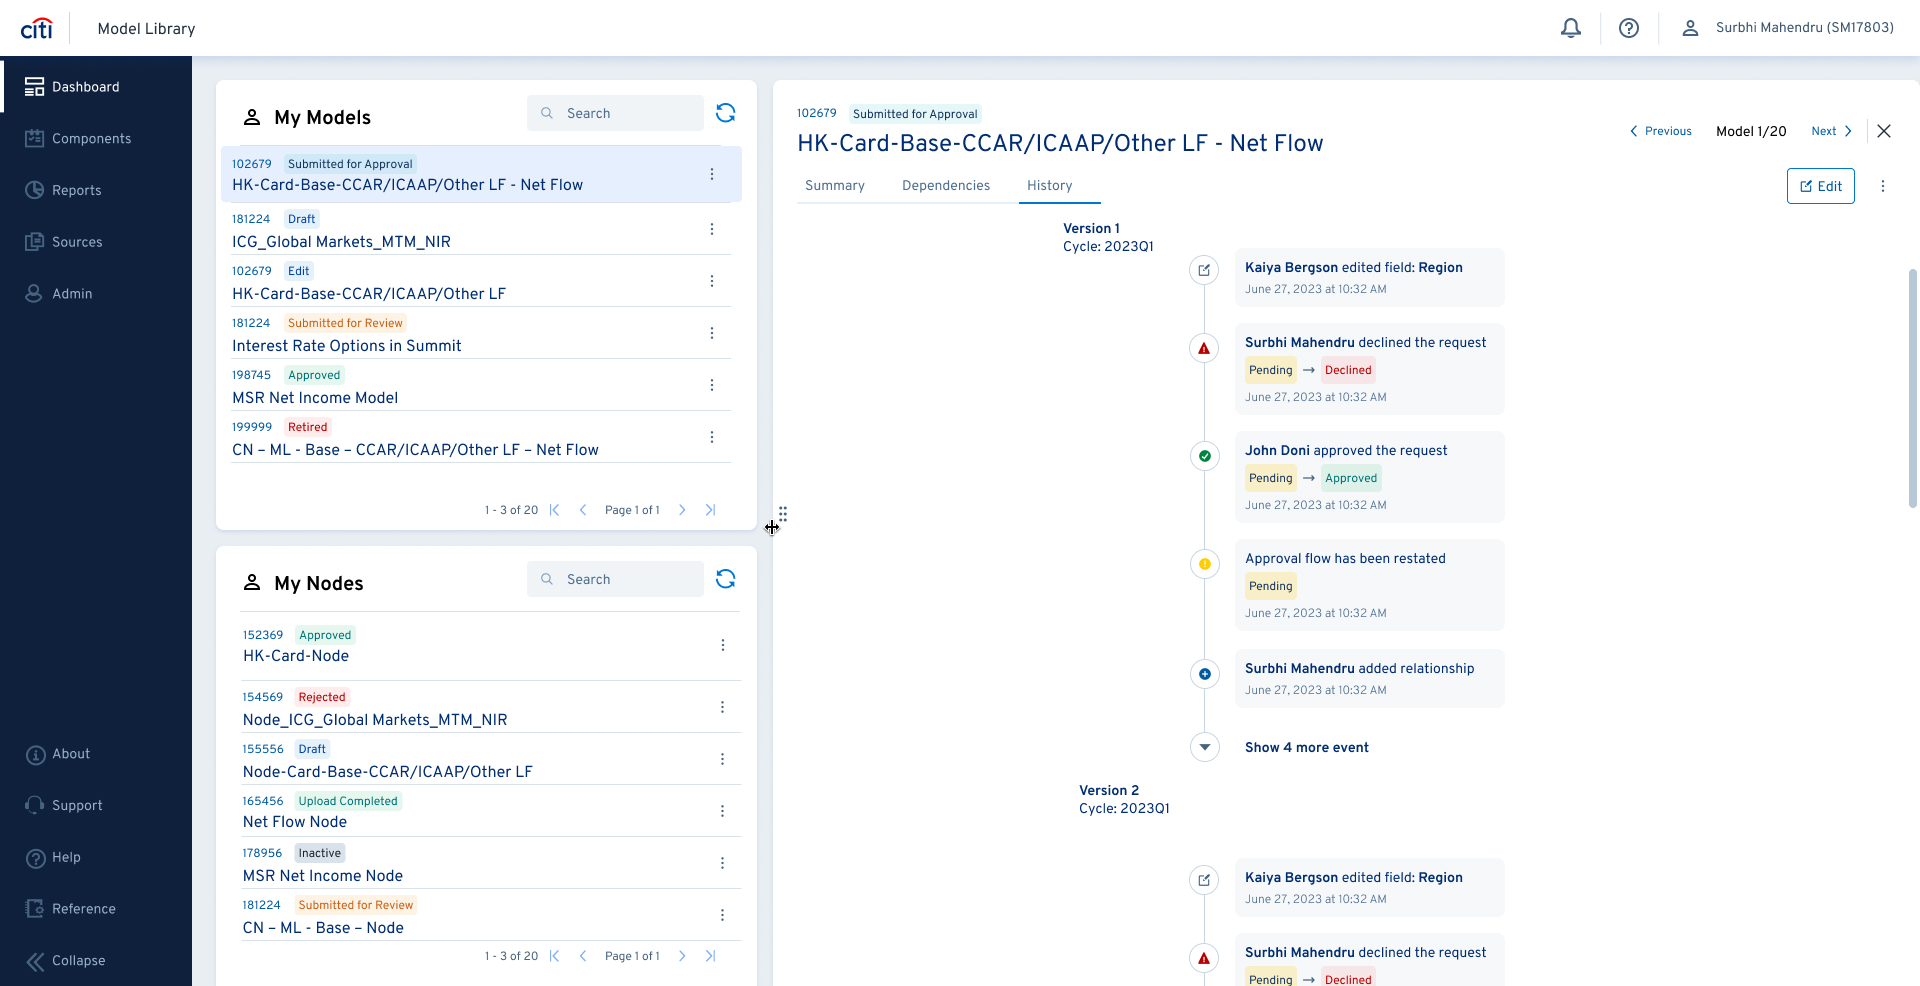
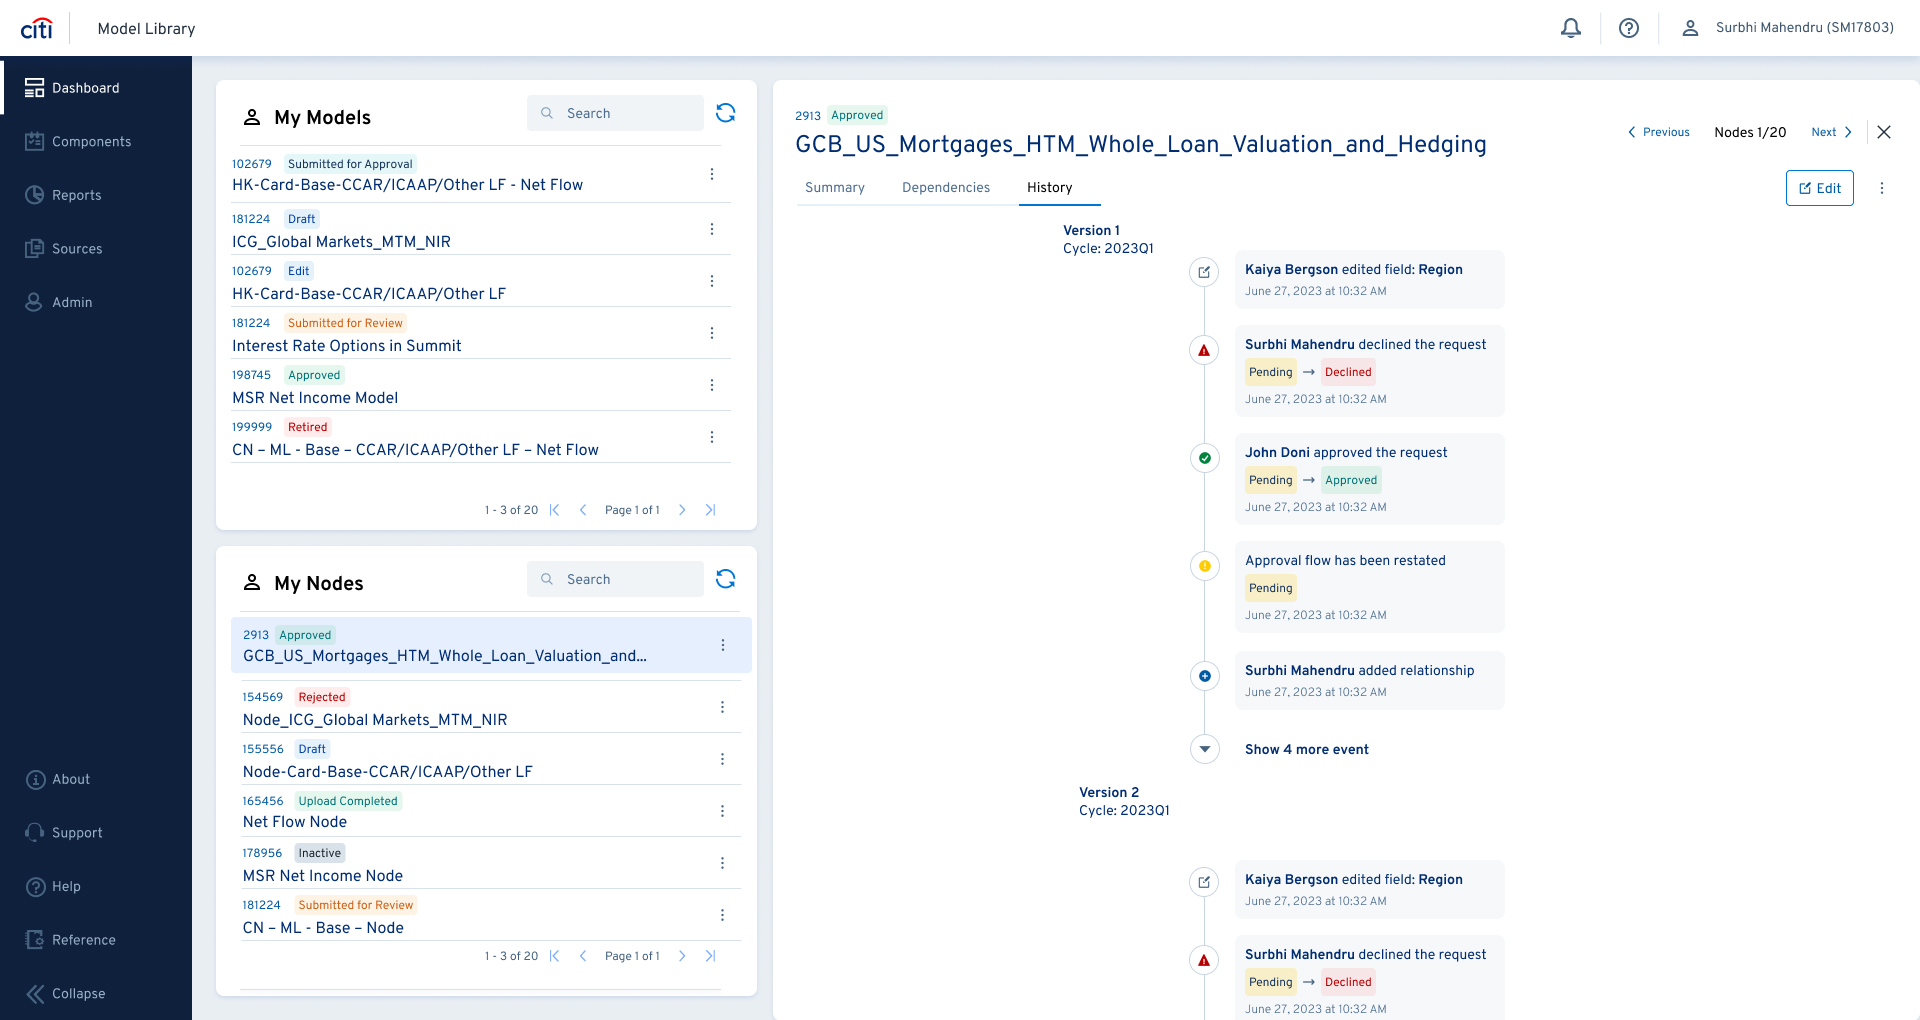
Audit-Ready History Log — Every Action Timestamped
Every action — approval, decline, edit — recorded with the user's SOEID and a precise timestamp. In banking: if it isn't audited, it didn't happen. Respond to regulatory requests in seconds, not days.
Before & After
From spreadsheet chaos to structured clarity
- 20+ spreadsheets, no version control
- No visual model relationships — all flat text
- Manual review deadline tracking — missed checks
- Zero audit trail
- Model onboarding took days of email
- Power users restarted custom views every session
- Single source of truth — one master list
- Interactive graph — Champion→Node connections visible
- Automated review scheduling by risk rating
- Complete SOEID-attributed audit trail
- Guided 5-step registration in under 15 minutes
- Saved filters and column preferences per user
Impact & Results
Compliance burden transformed into operational advantage
Task Success Rate
Moderated usability testing with Model Developers and Risk Managers on launch day.
Feature Adoption
Saved filters and custom views drove rapid adoption across global APAC/EMEA teams.
WCAG AAA
Industry-leading accessibility — complex tables, graphs, and filters fully screen-reader-ready.
Lifecycle Modules
Dev → Validation → Monitoring → Modification → Retirement — all in one platform.
Manual Errors Reduced
Guided registration and inline validation eliminated the most common onboarding errors.
Always Audit-Ready
History Log lets the bank respond to regulatory requests instantly — no scrambling.
Unique Challenges
The hardest parts of this project
Designing within Legal Constraints
Every UI word had to pass Legal review. I learned to write specs that included the user-facing copy AND the regulatory rationale — making reviews faster and fewer revisions come back.
Power-User Depth vs. New-User Clarity
SMEs wanted everything visible. New users needed progressive disclosure. Solution: compact default view with quick-expand for power users — both groups satisfied without compromise.
Accessible Data Visualisations
The graph is inherently visual. Making it accessible required ARIA-labeled nodes, keyboard traversal between connected models, and a "list view" alternative for screen readers.
Final Thoughts
"Thoughtful UX can turn a compliance burden into a strategic asset."
By treating data relationships as first-class citizens in the UI, we transformed a fragmented manual process into a unified digital workflow. This project proved that even in highly restricted fintech environments, thoughtful UX can drive both operational efficiency and regulatory safety — simultaneously. It opened a new market opportunity for CitiGroup.
Project Screens
Design Screens & Deliverables
Work Flow Screens
End-to-end user workflows showcasing the model registration, approval, and lifecycle management processes. These screens demonstrate the complete journey from model submission through to approval and monitoring.
Models Screens
Core models interface displaying the Activity feed, dependency relationships, and action logs. This section provides Risk Managers with real-time visibility into model status, change history, and audit trails for compliance tracking.
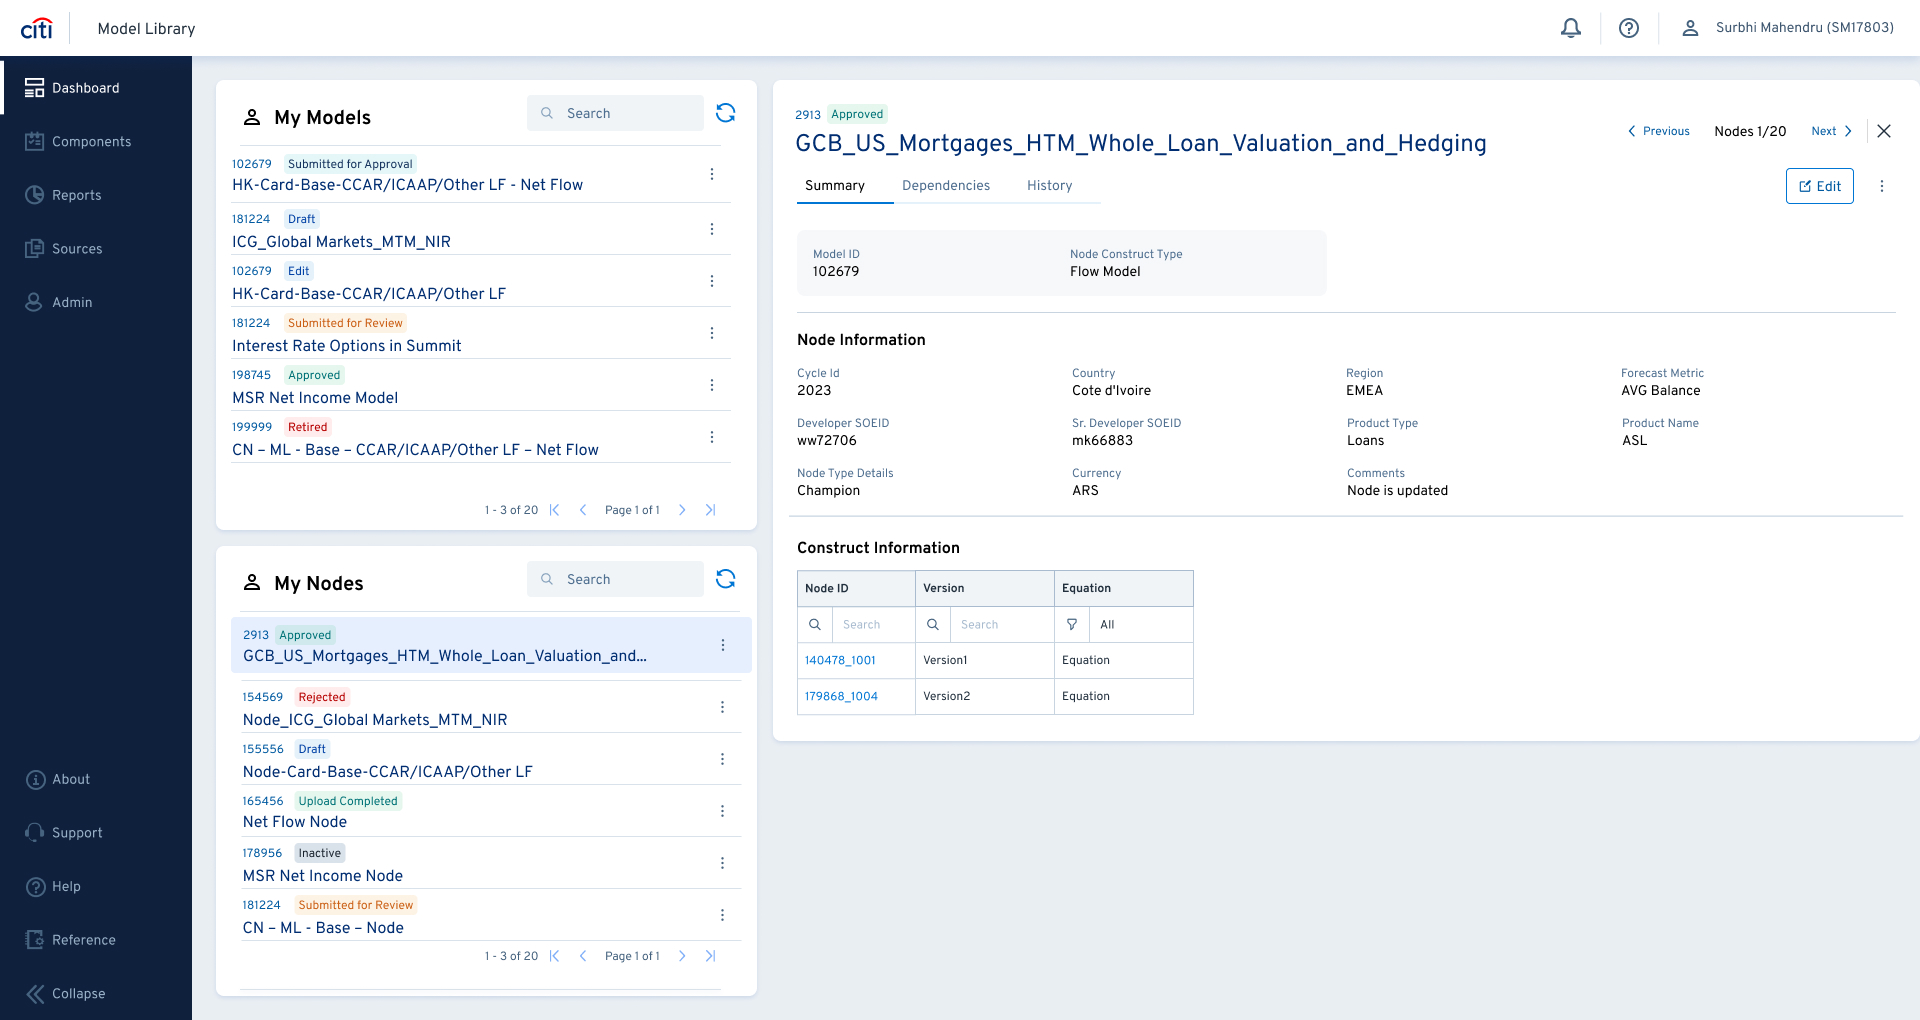
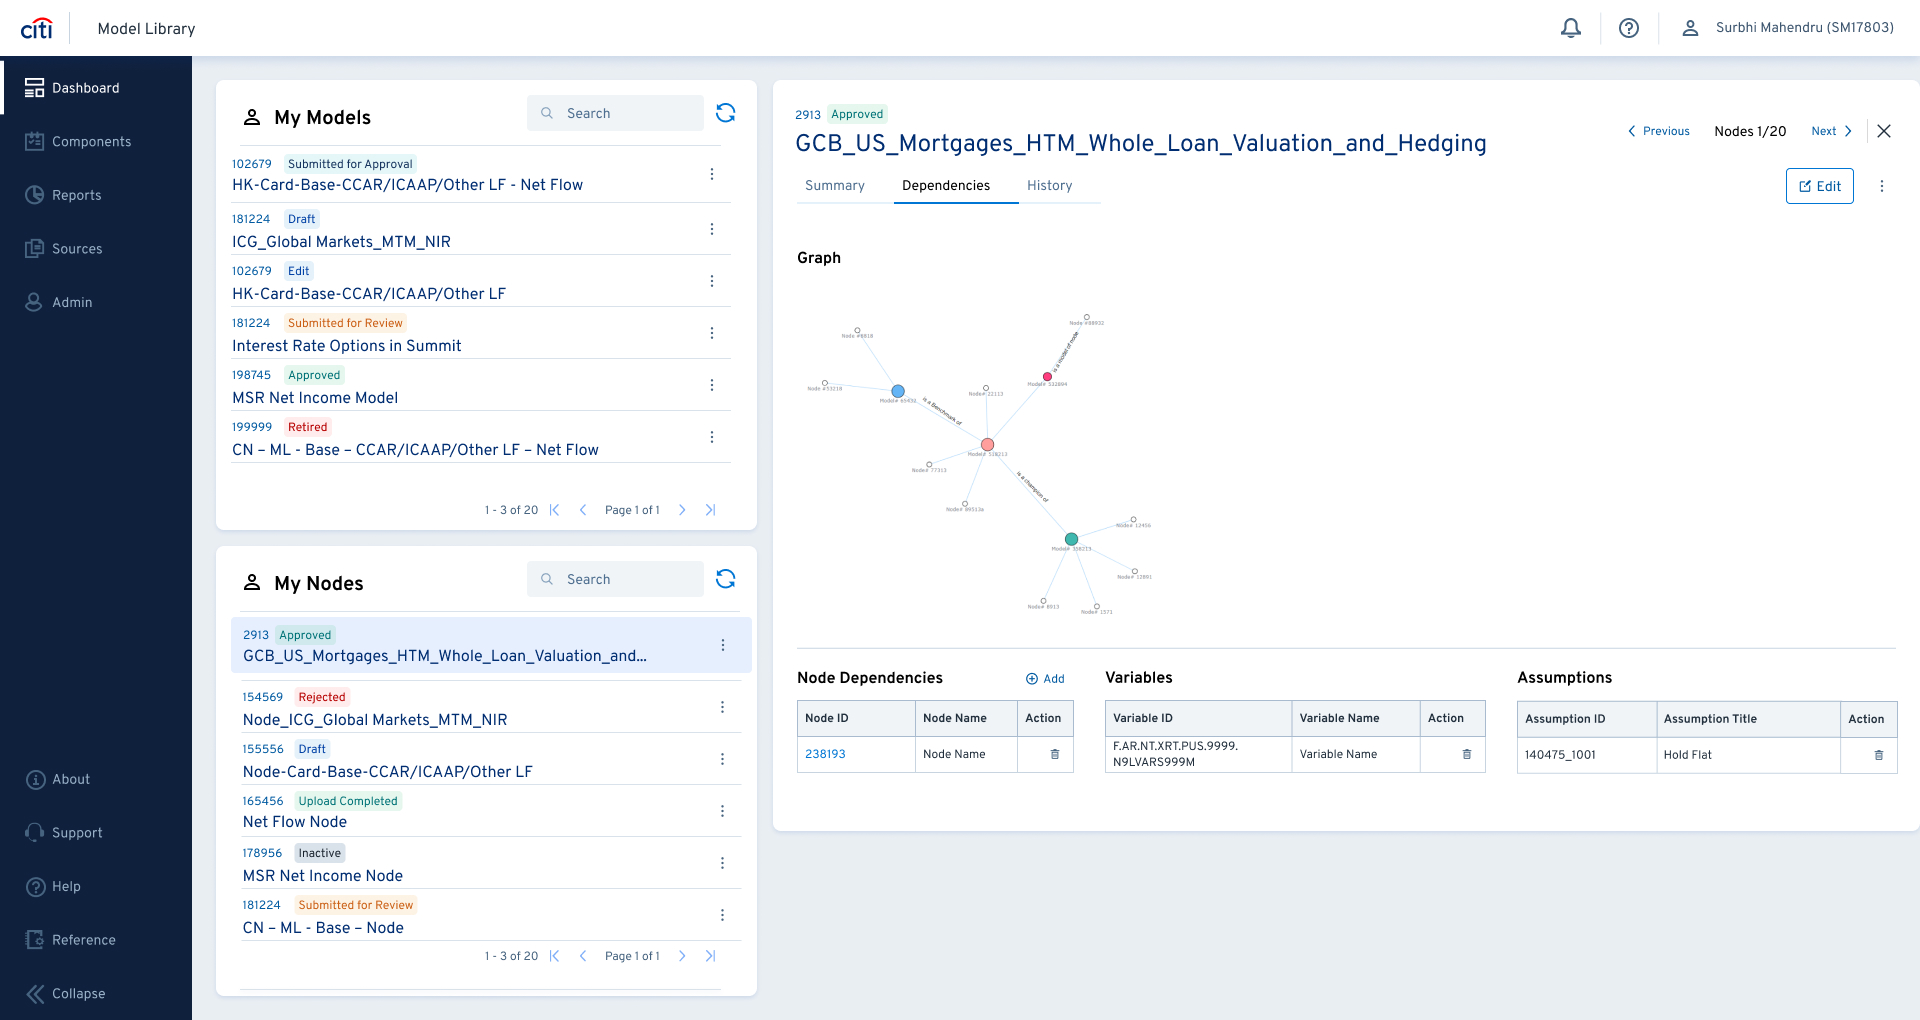
Nodes Screens
Node management interfaces showing detailed model information, relationships, and performance metrics. These screens enable users to drill into model specifics, view linked dependencies, and manage model metadata with full traceability.
Filters Screens
Advanced filtering and search capabilities allowing power users to create custom views, save filter presets, and manage column visibility. These screens demonstrate how users can quickly narrow down thousands of models by risk level, region, status, and ownership — reducing search time from hours to seconds.
Register New Models Screens
Guided 5-step model registration flow designed to minimize errors and ensure compliance at every stage. From basic model information through to risk classification and approval, each step uses progressive disclosure and inline validation to guide users without overwhelming them.